Carbon Footprint
Pursuant to FAR 52.223-22, SDL is developing a separate greenhouse gas reporting process from Utah State University (USU). Some categories will remain with USU since there are no reasonable methods for separating SDL’s data from USU’s. Beginning in FY2021, we have compiled the following data to meet these requirements.
Carbon Totals
| Fiscal Year | CO2 (kg) | CH4 (kg) | N2O(kg) | Gross MTCDE | Offsets (MTCDE) | Compost (MTCDE) | Non-Additional Sequestration (MTCDE) | Biogenic (MT CO2) | Net MTCDE |
|---|---|---|---|---|---|---|---|---|---|
| 2024 | 12,855,348 | 20,231 | 305 | 13,641.69 | 0 | 0 | 0 | 0 | 13,641.69 |
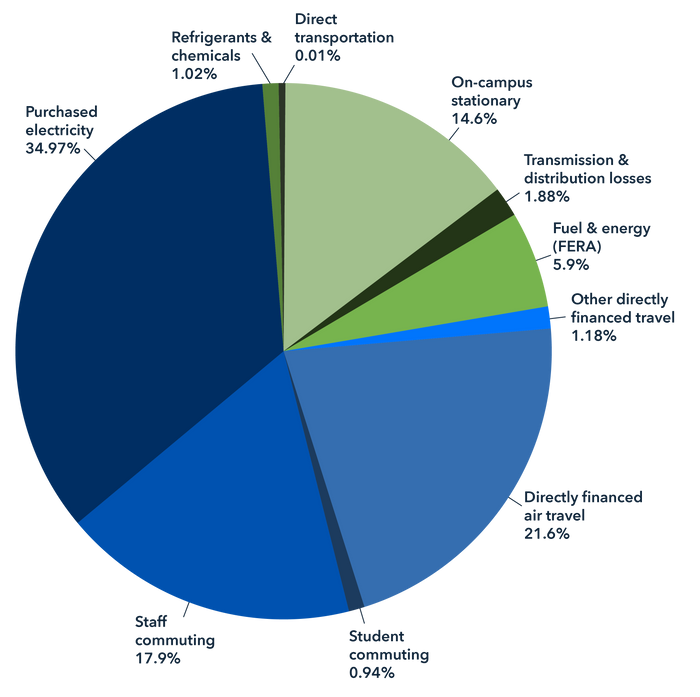
Carbon Sources
| Fiscal Year | Scope | Source | CO2 (kg) | CO2 (MTCDE) | CH4 (kg) | CH4 (MTCDE) | N2O (kg) | N2O (MTCDE) | GHG MTCDE |
|---|---|---|---|---|---|---|---|---|---|
| 2024 | 1 | Other On-Campus Stationary | 1,986,876 | 1,986.88 | 198 | 5.53 | 4 | 1.08 | 1,993.48 |
| 2024 | 1 | Direct Transportation | 41,380 | 41.38 | 1 | 0.03 | 1 | 0.28 | 41.69 |
| 2024 | 1 | Refrigerants & Chemicals | 0 | 0 | 0 | 0 | 0 | 0 | 138.6 |
| 2024 | 2 | Purchased Electricity | 4,672,796 | 4,672.80 | 134 | 3.73 | 199 | 54.28 | 4,730.81 |
| 2024 | 3 | Staff Commuting | 2,427,247 | 2,427.25 | 71 | 1.99 | 48 | 12.99 | 2,442.23 |
| 2024 | 3 | Student Commuting | 127,966 | 127.97 | 4 | 0.11 | 3 | 0.69 | 128.76 |
| 2024 | 3 | Directly Financed Air Travel | 2,933,334 | 2,933.33 | 34 | 0.94 | 35 | 9.46 | 2,943.73 |
| 2024 | 3 | Other Directly Financed Travel | 160,307 | 160.31 | 5 | 0.13 | 3 | 0.86 | 161.3 |
| 2024 | 3 | Fuel and Energy Related Activities | 252,624 | 252.62 | 19,777 | 551.79 | 3 | 0.73 | 805.14 |
| 2024 | 3 | T&D Losses | 252,819 | 252.82 | 7 | 0.2 | 11 | 2.94 | 255.96 |
Scopes
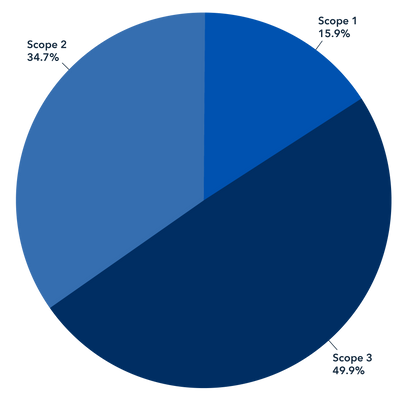
| Scope | 1 | 2 | 3 |
|---|---|---|---|
| Fiscal Year | 2024 | 2024 | 2024 |
| CO2 (kg) | 2,028,256 | 4,672,796 | 6,154,297 |
| CH4 (kg) | 199 | 134 | 19,898 |
| N2O(kg) | 5 | 199 | 101 |
| GHG MTCDE | 2,173.77 | 4,730.81 | 6,737.11 |